
QuantumLayers Blog
Everything you ever wanted to know, but never dared to ask, about Data.
- Inside the QuantumLayers Statistical Pipeline: Every Test, What It Checks, and When It Runs
 Every dataset in QuantumLayers runs through the same statistical pipeline. Here is each test in it, from outliers, Spearman correlation and OLS regression to ANOVA effect sizes, Kruskal-Wallis, Cramér’s V, ADF, CUSUM, STL seasonality, Holt-Winters and SARIMA forecasts, and VIF, the thresholds each applies, and how Benjamini-Hochberg correction decides what you see.
 - Joining Datasets Without Breaking Them: Grain, Fan-Out, and the Keys That Don’t Match
 Joining datasets is where multi-source analysis gains most of its value and picks up most of its errors. Here is what each join type keeps, why grain matters, how fan-out inflates totals and test statistics, how key mismatches drop records without warning, and a five-check routine to verify any join before it feeds a decision.
 - 1,026 Nobel Prizes, Four Assumptions, One Dataset (Live Nobel Foundation Data)
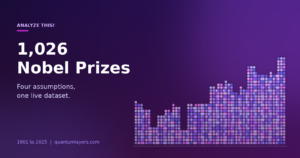 A live QuantumLayers demo: we loaded every Nobel Prize awarded since 1901, 1,026 in all, into a public dataset and tested four things people assume about the prize, from the lone genius to the gender gap.
 - What 10,877 Earthquakes in 30 Days Look Like (Live USGS Data)
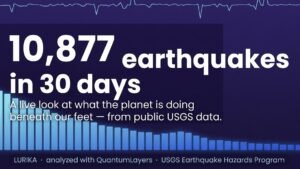 A live QuantumLayers demo: we pulled every earthquake the USGS recorded over 30 days — 10,877 of them — into a public dataset and charted what the planet has been doing beneath our feet.
 - What 45,716 Meteorite Landings Look Like (Live NASA Data)
 A live QuantumLayers demo: we loaded NASA’s full catalogue of 45,716 known meteorites into a public dataset and charted what more than a thousand years of space rock actually looks like.
 - 958 Volcanoes and 2.6 Billion Neighbours (Live Smithsonian Data)
 A live QuantumLayers demo: we loaded the Smithsonian’s catalogue of 958 Holocene volcanoes into a public dataset and asked who lives near them. The answer: more than 2.6 billion people within 100 km of a volcano.
 - 3,023 Squirrels, One Park, One Census (Live NYC Open Data)
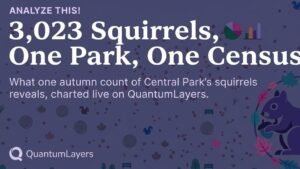 A live QuantumLayers demo: we loaded the 2018 Central Park Squirrel Census — 3,023 hand-counted squirrels — into a public dataset and charted what one autumn snapshot of one park’s squirrels reveals.
 - On-Premise QuantumLayers Deployment: How It Works and When to Choose It Over the Cloud
 QuantumLayers runs as a hosted service by default. An on-premise deployment moves the same application inside your own network so the data never leaves your environment. Here is what an on-premise install includes, what stays identical to the cloud, the two decisions unique to running it yourself, and a side-by-side table of the tradeoffs against the online version.
 - Connecting a Database to QuantumLayers: Every Supported Engine, With Examples
 QuantumLayers connects to seven external databases and warehouses: MySQL, PostgreSQL, SQL Server, Amazon Redshift, Azure Synapse, Google BigQuery, and ClickHouse. Here is what each connection needs, the two ways to define the data with SQL or a plain-English description, and worked examples for loading one as a dataset.
 - Monitoring Now Delivers to Slack and Webhooks, Not Just Email
 Dataset Monitors can now send change alerts to a Slack channel and to a signed webhook on your own systems, alongside email. The trigger stays the same: a genuine statistical change. Only the destination is new.
 - Analyze This!: A Public Dataset, Charted Live and Explained by the Statistics
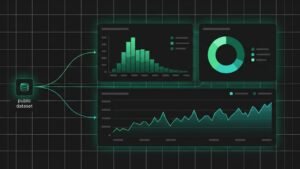 The Analyze This! series loads public datasets, from USGS earthquakes and NASA meteorites to Smithsonian volcanoes and the Central Park squirrel census, into QuantumLayers and charts them live. Here is how each post is built, from typed columns to ranked findings.
 - Correlation vs Causation: How to Tell a Real Driver From a Coincidence in Your Data
 Two columns that move together are the easiest finding to produce and the easiest to misread. Here is what a correlation coefficient actually measures, the four different reasons two variables track each other, why larger datasets manufacture more false signals, and the concrete steps that move a relationship from correlated toward genuinely causal.
 - Anomaly Detection in Data Analytics: How to Catch the Data That Breaks the Pattern
 What an anomaly is, the three kinds you have to tell apart, the detection methods from a simple z-score to a learned model, and why the hard part is never detection but deciding which anomalies are worth an alert.
 - Prescriptive Analytics Explained: How Data Teams Move From Predicting What Will Happen to Deciding What to Do
 Prescriptive analytics is the stage most maturity models put last and most organizations never reach. Here is what separates it from descriptive, diagnostic, and predictive analytics, how optimization and simulation turn a forecast into a recommended action under constraints, and why a trustworthy prescriptive decision depends on the statistical rigor of every stage beneath it.
 - Reading Charts, or Reading Findings: QuantumLayers Against Traditional BI
 Reading Charts, or Reading Findings: QuantumLayers Against Traditional BI Traditional BI was designed when computing was expensive and analyst time was the cheap, abundant resource, so it put its effort into a governed surface for a person to read. That ratio has since reversed. Comparing QuantumLayers with Tableau, Power BI, Looker, and Qlik on cost, speed, accuracy, and automation comes down to one difference the rest follow from: a dashboard hands you a chart to interpret, and QuantumLayers hands you the finding. The Premise Underneath the Dashboard Business intelligence tools were shaped by two assumptions that held for most of… Read more: Reading Charts, or Reading Findings: QuantumLayers Against Traditional BI
 - QuantumLayers Against Claude and ChatGPT: Where Each Fits in a Data Workflow
 QuantumLayers Against Claude and ChatGPT: Where Each Fits in a Data Workflow Two of these tools can produce a correlation matrix from a CSV. They look interchangeable on a small task and stop looking interchangeable the moment the task repeats, grows, or has to run without you. This post compares them on cost, speed, accuracy, and automation, and covers the case most comparisons miss: QuantumLayers ships an MCP server, so the answer is sometimes to use both at once. Two Shapes of the Same Question A general chat model with a code sandbox and a purpose-built analytics platform can land… Read more: QuantumLayers Against Claude and ChatGPT: Where Each Fits in a Data Workflow
 - Building With the QuantumLayers JDK: Load Order, Sign-In, and Your First Live Chart
 Building With the QuantumLayers JDK: Load Order, Sign-In, and Your First Live Chart The last post named the two ways into the API and left the JDK described but not yet used. This one takes that path in code. It covers the load order every module depends on, how to sign a user in from your own origin, and how to get a rendered chart on the page with a single function call. Where This Fits The first post argued for embedding QuantumLayers rather than rebuilding an analytics stack. The second went through the request envelope, the three authentication paths,… Read more: Building With the QuantumLayers JDK: Load Order, Sign-In, and Your First Live Chart
 - Connecting Google Analytics 4 to QuantumLayers: Turn Your GA4 Traffic Into Statistical Findings, Reports, and Monitors
 Marketing Analytics on QuantumLayers: Connect Google Analytics 4 and Let the Statistics Find What Moved How to connect a GA4 property through the API connector and its OAuth workflow, which ready-made GA4 query templates cover the questions marketers actually ask, and how Scheduled Reports and Monitors turn that live traffic data into a weekly briefing and a quiet alert that only speaks up when something genuinely changes. GA4 Shows You the Line. It Does Not Tell You If the Line Is Real Google Analytics 4 is very good at collecting behavioral data and arranging it into reports and explorations. What… Read more: Connecting Google Analytics 4 to QuantumLayers: Turn Your GA4 Traffic Into Statistical Findings, Reports, and Monitors
 - Introducing the QuantumLayers MCP Server: Bring Your Own Agent to Your Data
 Introducing the QuantumLayers MCP Server: Bring Your Own Agent to Your Data How QuantumLayers exposes the same tools that power QL-Agent over the Model Context Protocol, so any MCP-compatible client, from Claude Desktop and Claude Code to Cursor or an agent you built yourself, can list datasets, run analyses, build charts, and manage reports in your account, and how to decide when that is a better fit than reaching for QL-Agent directly. The Analysis Is Ready. Until Now, Your Own Agent Could Not Reach It. QL-Agent already lets you talk to your data in plain language from inside QuantumLayers. It… Read more: Introducing the QuantumLayers MCP Server: Bring Your Own Agent to Your Data
 - Introducing Monitoring: Let QuantumLayers Watch Your Data and Tell You Only When Something Changes
 Introducing Monitoring: Let QuantumLayers Watch Your Data and Tell You Only When Something Changes How a Monitor re-runs the same validated statistical pipeline behind AI Insights on a schedule you set, emails you only when a genuinely new pattern appears or an established one fades, and fills the gap between one-off analysis and recurring Scheduled Reports as the layer that watches for change so you do not have to. The Question Insights Cannot Answer on Their Own: What Changed? QuantumLayers’ AI Insights give you a rigorous snapshot of a dataset. The engine runs a nine-step statistical pipeline, corrects for multiple… Read more: Introducing Monitoring: Let QuantumLayers Watch Your Data and Tell You Only When Something Changes
 - Becoming a QuantumLayers Partner: A Recurring Revenue Line for Your Consulting Practice
 Becoming a QuantumLayers Partner: A Recurring Revenue Line for Your Consulting Practice Why a growing number of consultants and agencies are adding analytics to what they deliver without building a data team, how the partner program pays a recurring commission on every subscription you bring in, and the handful of client situations where pairing your advisory work with QuantumLayers pays off for both sides The Analytics Request Every Consultant Eventually Gets Whatever a consulting practice is nominally hired for, whether it is growth, operations, finance, or software, the same request tends to surface partway through the engagement: the client wants… Read more: Becoming a QuantumLayers Partner: A Recurring Revenue Line for Your Consulting Practice
 - Inside the QuantumLayers API: Actions, Auth, and the Two Ways to Call It
 Inside the QuantumLayers API: Actions, Auth, and the Two Ways to Call It The first post gave the map. This one walks the ground. Here is how the single AJAX endpoint actually behaves, how the three authentication options differ once you are minting tokens for real, and when to reach for raw API calls versus the bundled JavaScript Development Kit. Picking Up Where the Overview Left Off The previous post made the case for embedding QuantumLayers instead of rebuilding an analytics stack, and it sketched the shape of the API at arm’s length: one endpoint, three ways to authenticate, and… Read more: Inside the QuantumLayers API: Actions, Auth, and the Two Ways to Call It
 - Your App, Our Statistics Engine: Building Embedded Analytics on QuantumLayers
 Building Embedded Analytics on QuantumLayers A first look at using QuantumLayers as a backend for charts, statistical analysis, and AI insights inside your own product. This post covers how the API fits together as a single endpoint pattern, how the three authentication paths work, and why embedding the analytics has become a smaller decision than building it. The Part of the Roadmap Nobody Wants to Build Almost every product eventually grows an analytics surface. Customers want to see their numbers, slice them, and understand what they mean. The feature sounds modest until you sketch what sits behind it. You need… Read more: Your App, Our Statistics Engine: Building Embedded Analytics on QuantumLayers
 - Connecting Kaggle Datasets to QuantumLayers: How to Turn Any Public Dataset into a Live Analytical Dataset
 Connecting Kaggle Datasets to QuantumLayers: How to Turn Any Public Dataset into a Live Analytical Dataset How the Kaggle Public API authenticates requests with a username and key pair, why QuantumLayers only needs a dataset’s owner and slug to find it, and how the platform downloads, extracts, and runs the same statistical testing and AI-generated insights pipeline used for every other connected source Most of the Data Worth Analyzing Isn’t Yours Every other connector covered in this series deals with data your organization already owns: a Snowflake warehouse, a Databricks lakehouse, a production database, a Google Sheet someone on the… Read more: Connecting Kaggle Datasets to QuantumLayers: How to Turn Any Public Dataset into a Live Analytical Dataset
 - The Semantic Layer Becomes the Context Layer: Why AI Analytics Lives or Dies on What Your Metrics Mean
 The Semantic Layer Becomes the Context Layer: Why AI Analytics Lives or Dies on What Your Metrics Mean Why the quiet infrastructure that defines what “revenue” and “active customer” mean has become the most contested layer in the data stack, how AI agents turned metric consistency from a governance chore into a production requirement, and what the new open standard behind it means for any team putting analytics in front of a language model The Five Minutes Before Every Meeting There is a ritual that opens a surprising number of business reviews. Someone presents a number, someone else has a… Read more: The Semantic Layer Becomes the Context Layer: Why AI Analytics Lives or Dies on What Your Metrics Mean
 - What You Unlock When You Upgrade: A Tour of Every Pro and Enterprise Feature in QuantumLayers
 What You Unlock When You Upgrade: A Tour of Every Pro and Enterprise Feature in QuantumLayers How the higher dataset ceilings, automated Scheduled Reports, shared team workspaces, and enterprise-grade embedded analytics fit together, and which capability matters at which stage as a data practice grows from one analyst into a function the whole organization depends on The Free Tier Is Where You Learn the Product. The Pro and Enterprise Tiers Are Where It Becomes Infrastructure Most people meet QuantumLayers on the Free plan. They upload a CSV, watch the statistical pipeline surface findings they did not know were in the… Read more: What You Unlock When You Upgrade: A Tour of Every Pro and Enterprise Feature in QuantumLayers
 - Ingesting Snowflake Data: Turn a Warehouse Table into a Self-Refreshing Analytical Dataset
 Ingesting Snowflake Data: Turn a Warehouse Table into a Self-Refreshing Analytical Dataset How the Snowflake SQL API returns query results as JSON over HTTP, why key-pair JWT authentication is the right way to connect a service identity, and how QuantumLayers parses the ResultSet into a dataset that runs through automated statistical analysis and AI-generated insights The Warehouse Is Where the Numbers Live For a large share of data teams, Snowflake is the single source of truth. The fact tables that finance reconciles against, the customer dimension that every department joins to, the event models that the analytics engineers shape with… Read more: Ingesting Snowflake Data: Turn a Warehouse Table into a Self-Refreshing Analytical Dataset
 - Querying Databricks from QuantumLayers: How to Turn Your Lakehouse into a Live Analytical Dataset
 Querying Databricks from QuantumLayers: How to Turn Your Lakehouse into a Live Analytical Dataset How the Databricks SQL Statement Execution API returns query results as JSON over HTTP, why a Personal Access Token is all you need to authenticate, and how QuantumLayers ingests the response into a dataset with automated statistical analysis and AI-generated insights The Lakehouse Has Your Data. Now What? Databricks has become the gravitational center of the modern data stack. If your organization runs a lakehouse architecture, there is a good chance that most of your structured analytical data lives inside Databricks: sales transactions, customer records, product… Read more: Querying Databricks from QuantumLayers: How to Turn Your Lakehouse into a Live Analytical Dataset
 - Diagnostic Analytics: How Data Teams Can Answer “Why Did This Metric Change?” Without Spending a Week on It
 Diagnostic Analytics: How Data Teams Can Answer “Why Did This Metric Change?” Without Spending a Week on It Why root cause analysis is the most underdeveloped capability in modern data stacks, how statistical decomposition turns metric anomalies into causal stories, and how AI-augmented platforms are finally making diagnostic analytics a same-day workflow rather than a multi-week investigation The Question That Breaks Every Dashboard Every data team knows the moment. A dashboard refreshes on Monday morning and a number is wrong. Conversion is down 14% week-over-week. Active users dropped in three regions but spiked in a fourth. Net revenue retention slipped… Read more: Diagnostic Analytics: How Data Teams Can Answer “Why Did This Metric Change?” Without Spending a Week on It
 - Live Data Without the Export Cycle: Connecting QuantumLayers to Any REST API
 Live Data Without the Export Cycle: Connecting QuantumLayers to Any REST API How QuantumLayers’ REST API connector works, why Google Analytics is a perfect first connection, and what happens to your data the moment it arrives The Export Treadmill Every Monday morning, somewhere in your organization, an analyst is logging into Google Analytics, configuring a custom report, exporting a CSV, opening it in a spreadsheet, cleaning up the headers, pasting the numbers into a dashboard template, and emailing the result to a stakeholder who will glance at it on Tuesday. By Friday, that report is already out of date. By… Read more: Live Data Without the Export Cycle: Connecting QuantumLayers to Any REST API
 - Predictive Analytics for Non-Data-Scientists: How to Forecast Revenue, Churn, and Demand Using Data You Already Have
 Predictive Analytics for Non-Data-Scientists: How to Forecast Revenue, Churn, and Demand Using Data You Already Have How predictive analytics actually works under the hood, why most teams think they need more data than they do, and how AI-augmented platforms are making forecasting accessible to business professionals who have never trained a model The Prediction Problem Every business makes predictions. The sales director who orders extra inventory before the holiday season is making a prediction. The marketing manager who increases ad spend in Q3 because “that’s when conversions pick up” is making a prediction. The CFO who budgets for 10% revenue… Read more: Predictive Analytics for Non-Data-Scientists: How to Forecast Revenue, Churn, and Demand Using Data You Already Have
 - The Data Literacy Crisis: Why Your Team Has More Data Than Ever and Understands Less of It
 The Data Literacy Crisis: Why Your Team Has More Data Than Ever and Understands Less of It How the gap between data access and data understanding is costing organizations millions in bad decisions, why AI-powered analytics makes the problem both worse and better, and what it actually takes to build a data-literate workforce in 2026 The Paradox Nobody Wants to Confront Something strange has happened in the world of business analytics. Organizations have invested billions in data infrastructure. They have hired data engineers to build pipelines, purchased business intelligence platforms, deployed cloud data warehouses, and connected every operational system to… Read more: The Data Literacy Crisis: Why Your Team Has More Data Than Ever and Understands Less of It
 - Synthetic Data in Analytics: When Fabricated Numbers Tell the Truth (and When They Don’t)
 Synthetic Data in Analytics: When Fabricated Numbers Tell the Truth (and When They Don’t) How synthetic data generation works, why it’s becoming essential for privacy-constrained and data-scarce analytics workflows, and what statistical safeguards you need to ensure that artificially generated datasets actually preserve the patterns that matter The Data You Need Is the Data You Can’t Use Every analyst has encountered the same frustrating bottleneck. The data exists. The questions are clear. But the data contains personally identifiable information, or it falls under a regulatory framework that prohibits sharing it across teams, or there simply isn’t enough of it to… Read more: Synthetic Data in Analytics: When Fabricated Numbers Tell the Truth (and When They Don’t)
 - Beyond the Basics: Advanced Statistical Tests That Separate Signal from Noise
 Beyond the Basics: Advanced Statistical Tests That Separate Signal from Noise How QuantumLayers uses non-parametric fallbacks, stationarity testing, structural break detection, cross-correlation, multicollinearity diagnostics, and false discovery rate correction to ensure every insight is trustworthy Why Basic Tests Aren’t Enough In our previous post, Understanding Your Data: A Comprehensive Guide to Statistical Analysis, we covered the foundational statistical techniques that power modern data analysis: distribution testing, correlation, ANOVA, chi-square, regression, and time-series analysis. These techniques form the backbone of any serious analytical workflow, and they do an excellent job of surfacing patterns in well-behaved data. But real-world data is rarely… Read more: Beyond the Basics: Advanced Statistical Tests That Separate Signal from Noise
 - AI Hallucinations in Analytics: How to Make Sure Your AI-Generated Insights Are Actually True
 AI Hallucinations in Analytics: How to Make Sure Your AI-Generated Insights Are Actually True Why AI-powered analytics platforms sometimes fabricate patterns, invent statistics, and confidently present fiction as fact, and what you can do to catch it before it reaches a decision-maker The Trust Problem Nobody Wants to Talk About AI-powered analytics has reached a tipping point. Organizations across every industry are feeding their data into platforms that use large language models to generate insights, summaries, and recommendations in plain English. The promise is compelling: upload your dataset, ask a question, and get an answer you can act on. No… Read more: AI Hallucinations in Analytics: How to Make Sure Your AI-Generated Insights Are Actually True
 - Data Quality in the Age of AI Agents: Why Garbage In Now Means Bad Decisions at Machine Speed
 Data Quality in the Age of AI Agents: Why Garbage In Now Means Bad Decisions at Machine Speed How poor data quality transforms from a reporting nuisance into a strategic liability when AI agents act autonomously on your behalf The Stakes Have Changed For years, data quality was treated as a housekeeping problem. Duplicate records, inconsistent formatting, missing values, outdated addresses: these issues lived quietly in spreadsheets and databases, surfacing occasionally as a wrong number on a dashboard or a misrouted email. Analysts learned to work around them. They applied filters, flagged anomalies by hand, and used professional judgment to… Read more: Data Quality in the Age of AI Agents: Why Garbage In Now Means Bad Decisions at Machine Speed
 - Agentic Data Analytics and QL-Agent: How Conversational AI Is Automating Analytical Workflows on QuantumLayers
 Agentic Data Analytics and QL-Agent: How Conversational AI Is Automating Analytical Workflows on QuantumLayers How an AI-powered conversational agent transforms the way teams interact with data, automate analysis, and deliver insights, without writing code or navigating complex interfaces The Analytics Bottleneck Every organization has the same story. The data exists. The tools exist. The questions exist. But between the person who needs an answer and the answer itself sits a series of manual steps that slow everything down: logging into the analytics platform, selecting the right dataset, choosing appropriate chart types, configuring filters, running statistical tests, interpreting the results, and… Read more: Agentic Data Analytics and QL-Agent: How Conversational AI Is Automating Analytical Workflows on QuantumLayers
 - SaaS in the Age of AI Agents: Why Specialized Platforms Still Win, and How They’ll Evolve
 SaaS in the Age of AI Agents: Why Specialized Platforms Still Win, and How They’ll Evolve The case for domain-specific SaaS in an agentic world, and what the next generation of analytical platforms looks like The Narrative: Agents Will Replace Everything If you follow technology commentary in 2026, the prevailing narrative is stark: agentic AI systems will replace traditional software. The argument goes something like this: if an AI agent can autonomously orchestrate workflows across systems, why do you need a dedicated application for each function? Why pay for a project management tool when an agent can create tickets from… Read more: SaaS in the Age of AI Agents: Why Specialized Platforms Still Win, and How They’ll Evolve
 - Connecting Your WooCommerce Store to QuantumLayers: A Practical Guide to E-Commerce Analytics
 Connecting Your WooCommerce Store to QuantumLayers: A Practical Guide to E-Commerce Analytics How to use the WooCommerce REST API or a direct MySQL database connection to feed live store data into QuantumLayers for automated statistical analysis and AI-powered insights The E-Commerce Analytics Problem WooCommerce powers millions of online stores worldwide, and every one of them generates a steady stream of valuable data: orders, products, customers, refunds, coupons, and more. The WooCommerce admin dashboard provides basic reporting – total sales, top products, orders by status – but it wasn’t designed for the kind of deep analytical work that drives strategic decisions.… Read more: Connecting Your WooCommerce Store to QuantumLayers: A Practical Guide to E-Commerce Analytics
 - From Dashboards to Decisions: How AI-Augmented Analytics Closes the Last-Mile Gap in Business Intelligence
 From Dashboards to Decisions: How AI-Augmented Analytics Closes the Last-Mile Gap in Business Intelligence How combining multi-source data integration, statistical analysis, and AI interpretation turns passive dashboards into actionable business recommendations The Dashboard Paradox Business intelligence has a well-known problem that rarely gets discussed openly. Organizations invest significant time and money building dashboards – connecting data sources, designing visualizations, crafting KPI summaries – only to find that most of these dashboards are viewed once or twice and then quietly forgotten. Industry research consistently estimates that the majority of BI dashboards go unused within months of deployment. The data is there.… Read more: From Dashboards to Decisions: How AI-Augmented Analytics Closes the Last-Mile Gap in Business Intelligence
 - Why Statistical Preprocessing Matters: Making AI Analysis Efficient and Effective
 Why Statistical Preprocessing Matters: Making AI Analysis Efficient and Effective How extracting statistical patterns before LLM analysis reduces costs, improves accuracy, and generates better insights The Token Cost Problem Large language models like Claude, GPT-4, and others have revolutionized data analysis by enabling natural language interpretation of complex patterns. However, these models operate under significant constraints: they charge by the token (roughly a word or word fragment), they have context window limits that restrict how much data they can process at once, and their computational costs scale linearly with input size. When you want to analyze a dataset with thousands… Read more: Why Statistical Preprocessing Matters: Making AI Analysis Efficient and Effective
 - Understanding Your Data: A Comprehensive Guide to Statistical Analysis
 Understanding Your Data: A Comprehensive Guide to Statistical Analysis How modern analytics platforms use statistical tests to unlock meaningful insights from complex datasets The Challenge of Understanding Complex Data When faced with a dataset containing dozens or hundreds of columns, each with thousands of rows, knowing where to start your analysis can feel overwhelming. A typical business dataset might contain numeric values like sales figures and customer ages, categorical information like product categories and regional offices, and temporal data tracking when events occurred. Hidden within this complexity are patterns, relationships, and anomalies that could drive better decisions, but finding them… Read more: Understanding Your Data: A Comprehensive Guide to Statistical Analysis
 - The Data Ingestion Challenge: How Modern Analytics Platforms Handle Multiple Sources
 The Data Ingestion Challenge: How Modern Analytics Platforms Handle Multiple Sources An exploration of data ingestion approaches and what to consider when choosing an analytics platform The Fragmented Data Landscape Modern organizations face a fundamental challenge when it comes to data analysis. Business data doesn’t live in one place anymore. Customer information might sit in a CRM database, sales figures could be exported to CSV files on a shared drive, marketing metrics flow through various APIs, and financial reports might be maintained in Google Sheets by the accounting team. Each of these sources contains valuable insights, but accessing and analyzing… Read more: The Data Ingestion Challenge: How Modern Analytics Platforms Handle Multiple Sources